
 Lizaveta Herman
The short answer
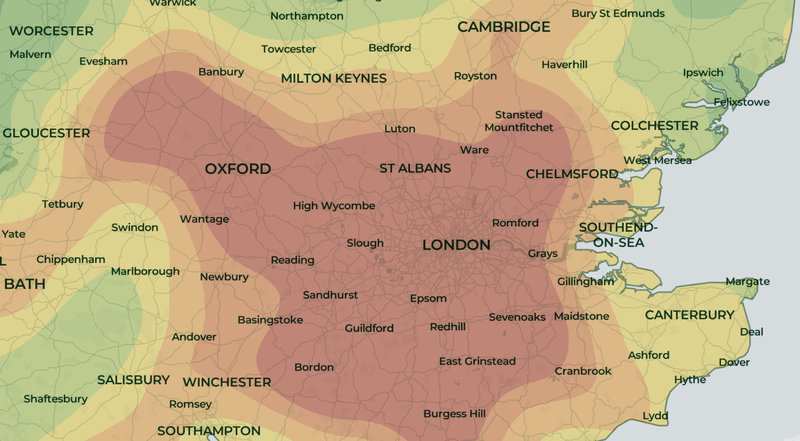
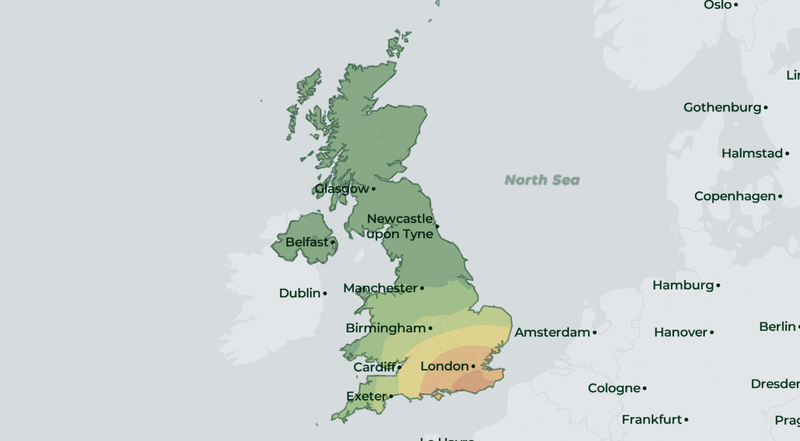
London's median asking rent reached £46.15 per square metre (m²) a month in October 2026, on Torquity listing data, October 2026. Homes for sale asked £7,558 per m². Both figures, hide a wide spread. Prime W1 postcodes ask more than £100 per m² in rent. Croydon asks about £31.
Asking prices held stable against September. For an investor the capital still asks a high entry price. The cash return stays thin unless the purchase price comes down.
London rents and house prices in October 2026
- Homes to rent on the market at the end of October: 34,824. New rental listings during the month: 41,012.
- Median asking rent: £46.15 per m² for everything on the market, £41.67 per m² for new listings.
- Typical asking rents: £1,950 a month for a one-bed, £2,600 for a two-bed, £3,500 for a three-bed.
- Homes for sale on the market: 81,039. Median asking price: £7,558 per m².
- Typical asking prices: £485,000 for a two-bed and £650,000 for a three-bed.
The sale side passed our quality checks in both September and October, so we can compare the months. The asking price per m² for homes on the market moved 0.3%, which we treat as stable. New listings asked 1.4% less per m², also stable. Fewer homes sat on the market: 3.6% fewer than at the end of September.
Official figures point the same way. The ONS puts London's average rent at £2,350 a month in October 2026, the highest of any region. London house prices fell 3.5% in the year to September. Inner London fell 7.2% and flats fell 6.3%.
Our October figures for southern England, the Midlands and the North and Scotland and Wales use the same method.
Inside London: the postcode spread
Prime central postcodes sit far above the city median. Asking rent per m² a month in October:
- W1K (Mayfair): £111.66 per m², with asking prices of £27,917 per m²
- W8 (Kensington): £95.36 rent, £17,222 to buy
- SW7 (South Kensington): £78.14 rent, £17,724 to buy
- W2 (Bayswater and Paddington): £74.68 rent across 1,037 listings, £13,265 to buy
Outer and east London postcodes ask far less per m² to rent and to buy:
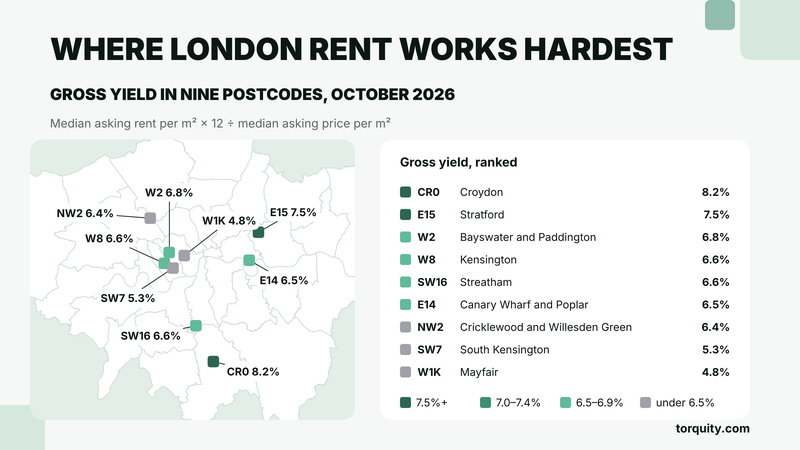
- E14 (Canary Wharf and Poplar): £43.53 rent across 1,104 listings, £7,989 to buy
- E15 (Stratford): £40.00 rent, £6,434 to buy
- NW2 (Cricklewood and Willesden Green): £36.88 rent, £6,955 to buy
- SW16 (Streatham): £33.16 rent, £6,057 to buy
- CR0 (Croydon): £30.65 rent, £4,507 to buy
Moving out, prices fall faster than rents. W1K asks about 21 years of rent per m², E14 about 15 and Croydon about 12. Our deal analyses in Poplar and Streatham show how those postcodes work on a single home.
A few postcodes moved by more than 2% on asking price per m² between September and October. SE18 (Woolwich) rose 3.0%, IG11 (Barking) rose 3.2% and SW16 rose 2.1%. NW11 (Golders Green) fell 3.4%. One month of asking data makes a weak trend, so treat these as signals to watch.
Worked example: a two-bed flat in E14
Take a two-bed flat in E14 at £500,000 and let at £2,700 a month. Both sit close to the postcode's October asking levels, but they remain our assumptions. Stamp duty with the 5% surcharge comes to £40,000 at current rates. Legal costs add £2,000.
- Gross rent: £32,400
- Management at 12% plus VAT: £4,666
- Two weeks' void: £1,246
- Service charge: £3,000 (our assumption)
- Repairs, insurance and certificates: £1,500
- Landlord database fee: £65
- Net income before finance: £21,923
That gives a net yield of 4.0% on the full £542,000 cost. Add a 75% mortgage at 5.5% and interest takes £20,625. The flat leaves £1,298 a year before tax on £167,000 of cash, a 0.8% return.
Run your own E14 address through our free rent calculator to check the rent before you trust this margin.
The same arithmetic explains why lenders' data puts London last. Fleet Mortgages measured a 6.4% average yield for Greater London in Q3 2026, against 7.9% across England and Wales.
Where the numbers break
Flats carry costs that houses avoid. Service charges in new-build blocks can run well above our £3,000, and leases need checking. A rise of £1,000 in the service charge cuts the flat's cash return by three quarters.
Prices may keep sliding. ONS shows London flats down 6.3% in a year to September. A buyer who pays October's asking price may find the valuation comes in lower.
Rates hurt London most. Each extra point on a £375,000 loan costs £3,750 a year, nearly three times the flat's cash flow.
Asking data also overstates. Our figures show what landlords and sellers ask. Acheived rents and agreed prices often land below them, especially in prime postcodes.
Checklist for a London purchase
- Compare the asking price per m² with the postcode median before you view.
- Ask for three years of service charge accounts and the lease length.
- Check the rent against achieved rents on comparable lettings in the same block or street.
- Run the deal at 5.5% and at 6.5% before you offer.
- Look one postcode further out: the rent per m² often falls less than the price per m².
- Budget for the 5% stamp duty surcharge in your cash, not your loan.
Where Torquity fits
Torquity estimates rent from comparable lettings with a confidence range. It calculates net yield, DSCR and cash-on-cash for any London home. Our London market page tracks the city's figures month by month. The rent calculator gives a quick rent check before you book a viewing.
General information, not tax or financial advice.
How we wrote this
Liza Herman, Research and Marketing at Torquity, wrote this article with AI assistance in drafting. Rent and price figures per m² come from Torquity listing data for October 2026. They describe asking rents and asking prices, not achieved rents or sale prices. Areas appear only with at least 30 listings. Rental changes against September are left out because September's rental data failed our quality checks. Wider context comes from ONS, Private rent and house prices, UK: November 2026 (18 November 2026), and the Fleet Mortgages Rental Barometer for Q3 2026 (5 October 2026). Stamp duty comes from GOV.UK. We checked all sources on 19 November 2026. The E14 flat, its rent, its costs and the mortgage rate are our own assumptions.